I would like to share with you on my thoughts on the market opportunities.
Overvalued Market, Uneven Returns: Where to Look Next in 2026
By Charlie Tian
Dec. 3, 2025
The stock market delivered another strong performance this year, extending the solid gains seen in 2023 and 2024. As of Dec. 2, about 65% of S&P 500 companies are up year to date, while 35% are down.
However, a closer look reveals a very different picture beneath the surface. Only 161 companies—roughly 32% of the S&P 500—have outperformed the index itself. This can be seen in the chart below, where green boxes represent stocks that outperformed the S&P 500 and red boxes represent those that underperformed.
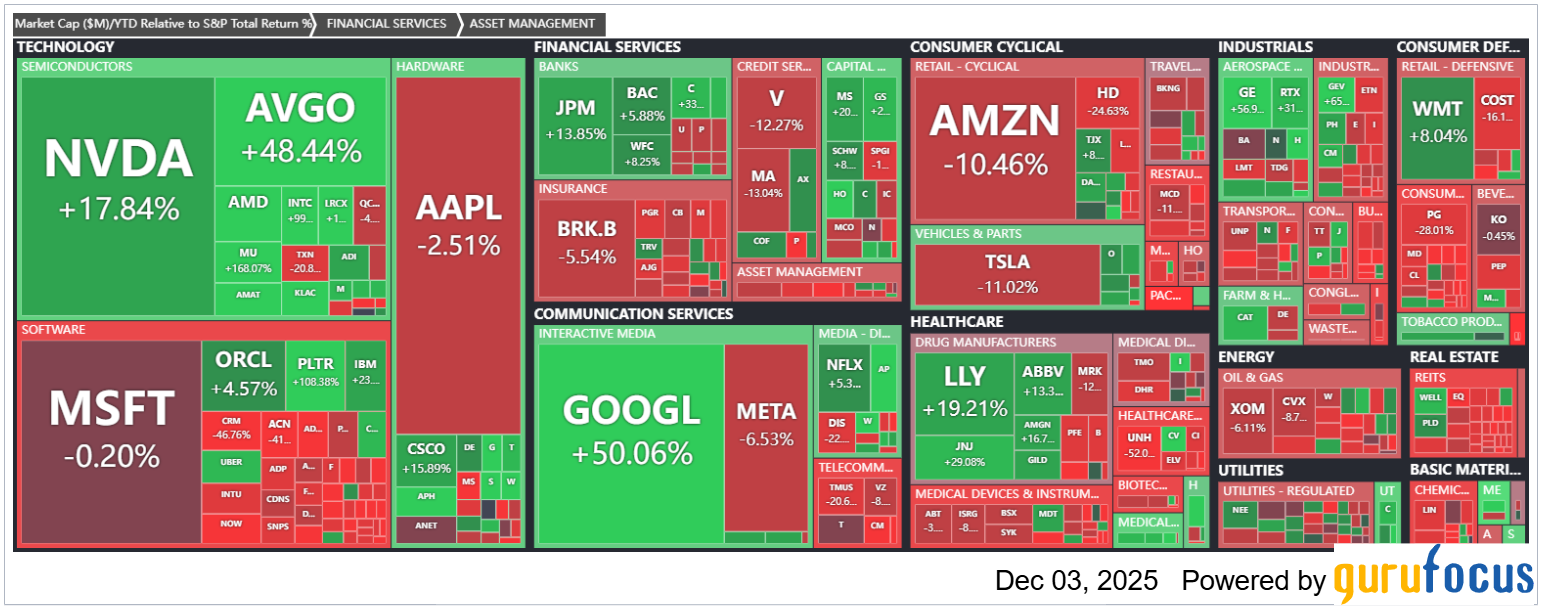
Date: Dec. 2, 2025. Source: GuruFocus.com
Importantly, the outperformance has not been evenly distributed across sectors. Fueled largely by optimism around artificial intelligence, technology stocks account for a disproportionate share of the winners. By contrast, stocks in sectors such as energy, real estate, consumer defensive, and even financial services have mostly lagged the broader market.
After three consecutive years of above-average returns, market valuations have become stretched. By virtually every major metric—including the Buffett Indicator, Shiller P/E and GuruFocus Value.—the market now appears overvalued. This raises a critical question for investors: Where should we invest from here?
Once again, the Shiller P/E ratio offers useful clues. Below are the Shiller P/E ratios alongside traditional P/E ratios for the 11 sectors of the S&P 500, which help highlight where valuations may still be relatively reasonable—and where risks may be elevated.
| Sector | Number of Stocks | Shiller P/E | Regular P/E |
| Financial Services | 69 | 21.2 | 17.5 |
| Energy | 22 | 25.7 | 17.5 |
| Basic Materials | 20 | 26.6 | 30.4 |
| Consumer Defensive | 37 | 27.6 | 30.0 |
| Healthcare | 60 | 30.3 | 28.8 |
| Utilities | 31 | 31.2 | 21.1 |
| Industrials | 72 | 32.1 | 28.2 |
| Real Estate | 31 | 42.3 | 48.5 |
| Communication Services | 24 | 46.6 | 26.6 |
| Consumer Cyclical | 54 | 50.8 | 35.3 |
| Technology | 82 | 64.9 | 40.5 |
| S&P 500 | 500 | 39.6 | 29.1 |
Date: Dec. 2, 2025. Source: GuruFocus.com
Clearly, the technology sector stands out as the most expensive by both Shiller P/E and traditional P/E measures. In contrast, financial services and energy remain among the more attractively valued sectors relative to the broader market.
In this environment, selecting individual stocks becomes more important than relying on broad market index investing.
About: Charlie Tian, Ph.D. is the founder and Chief Executive Officer and portfolio manager of GuruFocus Investments, LLC, an SEC-registered investment management firm.
Read More Blogs:
- Visa and Mastercard in an AI World: Separating Fear from Reality
- Overvalued Market, Uneven Returns: Where to Look Next in 2026
- 3 Undervalued Wide-Moat Stocks You May Be Overlooking
- Berkshire's Biggest New Bet: Alphabet (Google)
- GuruFocus (GF) Value: a Better Valuation Measure vs. PE
This research report has been prepared by GuruFocus Investments, LLC, an investment adviser registered with the U.S. Securities and Exchange Commission (SEC). Registration as an investment adviser with the SEC does not imply a certain level of skill or training.
The information contained in this report is provided for informational and educational purposes only and should not be construed as investment advice, an offer, or a solicitation to buy or sell any security or to participate in any investment strategy. Any opinions or views expressed herein are those of the author(s) and are subject to change without notice.
GuruFocus Investments, LLC does not accept liability for the content of this email, or for the consequences of any actions or inactions taken on the basis of the information provided. The content of this email is not investment advice and any opinions or assertion contained in this email do not represent the opinions or beliefs of GuruFocus Investments, LLC or any of its respective employees.
The information presented is believed to be reliable, but its accuracy and completeness cannot be guaranteed. Past performance is not indicative of future results. Investing involves risk, including possible loss of principal.
This communication is intended solely for the use of the individual or entity to whom it is addressed. Unauthorized use, distribution, or copying of this communication or its contents is prohibited.